Introducción
Answer-seizure ratio (ASR) y average call duration (ACD) son las medidas comúnmente usadas para indicar la calidad de la ruta Voip. Son los términos más mencionado entre los proveedores de Voip.
Usted necesita entender estos conceptos para que seleccione las mejores rutas de sus proveedores, prever alto volumen de llamadas , determinar la demanda del tráfico , medir la calidad de su infraestructura y tomar correctivos cuando la calidad de la llamada se deteriora
Descripcion
ASR (Answer-Seizure Ratio)
ASR es el porcentaje de número de llamadas conectadas exitosamente frente al número de intentos de llamadas
ASR % = (total número de llamadas exitosas / total número de llamadas marcadas) × 100
Por ejemplo, si fueron 156 intentos de llamadas y solo conectaron exitosamente 62, entonces:
ASR (%) = (62 [llamadas exitosas] / 156 [Intentos de llamadas]) x 100 = 39.74%
ACD (Average Call Duration)
ACD es la medida del largo de la duración de la llamada sobre la red
ACD = Duración de todas las llamadas contestadas / número de llamadas contestadas
Por ejemplo, si fueron 62 llamadas contestadas con una duración total de 145 minutes, entonces:
ACD = 145 [duración de todas las llamadas contestadas] / 62 [total de número de llamadas contestadas] = 2.34 minutes
¿Que es normal?
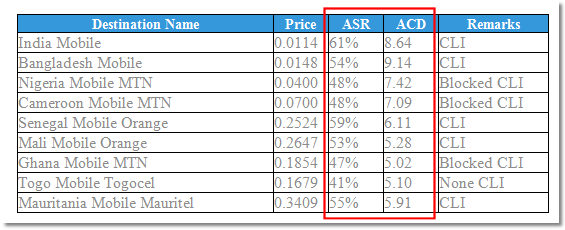
ASR debe estar alrededor de 40–50%, y algunas veces hasta 60% puede indicar una excelente calidad del servicio.
Un ACD de 4–5 minutos es considerado okay, por encimad de 6 minutos es excelente
Un alto ASR indica una red de confianza desde que más llamadas se han contestado exitosamente
Un alto ACD sugiere cque muy pocas llamadas han sido abandonadas debido a una buena calidad
Bajo ASR/ACD
ASR
Valores bajos de ASR pueden ser causados por:
- Comportamiento del usuario
- Líneas de destino ocupadas
- Congestión en switches de terminación (problemas en la capacidad de la portadora)
ACD
La expectativa del ACD debe ser alrededor de 3 minutos. Un corto ACD puede ser el indicador de problemas en la calidad del audio causando que el usuario cuelgue por estar insatisfecho con la calidad de la comunicación , lo cual no lo motiva a volver a marcar
Algunos factores pueden reducir la calidad de la llamada y un provocar un bajo ACD:
- Congestión
- Largo el tiempo del PDD (Post Dial Delay) Tiempo que transcurre entre la marcación del ultimo digito y el timbre
- Bucles
- FAS (False Answer Supervision – No sale y se cae la llamada)
- Eco
- Jitter (Variaciones de retardos)
- Retardos (Retardos de mas de 300 ms decrementa el ACD)
- Paquetes perdidos
- Baja calidad en los códec de audio
- La capacidad (medida en paquetes por segundo de PPS) de la red ethernet puede tener un cuello de botella
- Tambien muchos saltos (Session Border Controller passing media through them) will also decrease ACD
- Perfil de trafico puede contribuir a un bajo ACD
Important considerations
User behavior
Since busy signals and other rejections by the called number, count as call failures, the calculated ASR can vary depending on user behavior.
ASR is an industry standard for measuring network quality. However, it is not very suitable for this task because it affected by user behavior. In other words, if a call is not answered, even though the network is not at fault, the ASR would be reduced since it was an uncompleted call, and this would indicate that quality is low. Because for a given hour of the day, the percentage of unanswered calls is always the same, from day to day, this offset averages out. Carriers monitor the ASR trend and treat it as a relative measurement.
Differences by Destination
It is not trivial to determine quality based on the numbers. For example, ASR and ACD vary by route. A typical ASR to Pakistan is lower than that to France. The reasons for this include the quality of the network and that it’s less likely that a call to Pakistan will be taken by an answering machine.
Differences by point of view
For the same calls, ASR and ACD can be different when measured by the customer and the provider. I will try to explain this with an example using ASR. Imagine a customer makes two calls. One is answered and the other is not. So, the ASR for the user is 50%. These two calls were made using least cost routing with two providers. The first call was instantly handled by the first provider. The second call required both providers and it failed. So, the ASR for the first provider is 50% and for the second provider it is 0%. As you can see, one call attempt by a customer can generate several call attempts for the providers. This difference generates different statistics, so it is very important to keep this in mind when talking about ASR and ACD with your customers and providers.
Other quality metrics worth mentioning
PDD
Post-dial delay (PDD) is the time it takes to receive feedback after a user has finished dialing (after they pressed the dial button on their phone). This feedback can be in the form of a dial tone, a recorded announcement or the call being abandoned. A low PDD means a better user experience. Consumers are generally used to the short PDD of a PSTN and often react negatively when there is a long pause after dialing.
In case of higher PDD, it is expected that there is no dial tone for the subscriber to initiate a call.
PDD should be not more than 4-5 seconds, and anything below 2 is considered excellent.
NER
The best metric to describe network performance is the network effectiveness ratio (NER). It is designed to exclude user behavior and it represents the pure network performance better.
It’s calculated as:
NER = (answers + user busy + ring no answer + terminal rejects) / number of total call attempts (seizures)
It is sad that this metric is not used in the industry as the standard because it is much more suitable compared to the ASR, which includes user behavior and is not a pure network performance metric.
Good to know
Carriers seldom consider ACD when defining SLAs. Their focus is only ASR.
ASR is defined in ITU SG2 Recommendation E.411: “International network management – Operational guidance”.